Solar Panel Installation Cost in 2026: Full Price Breakdown
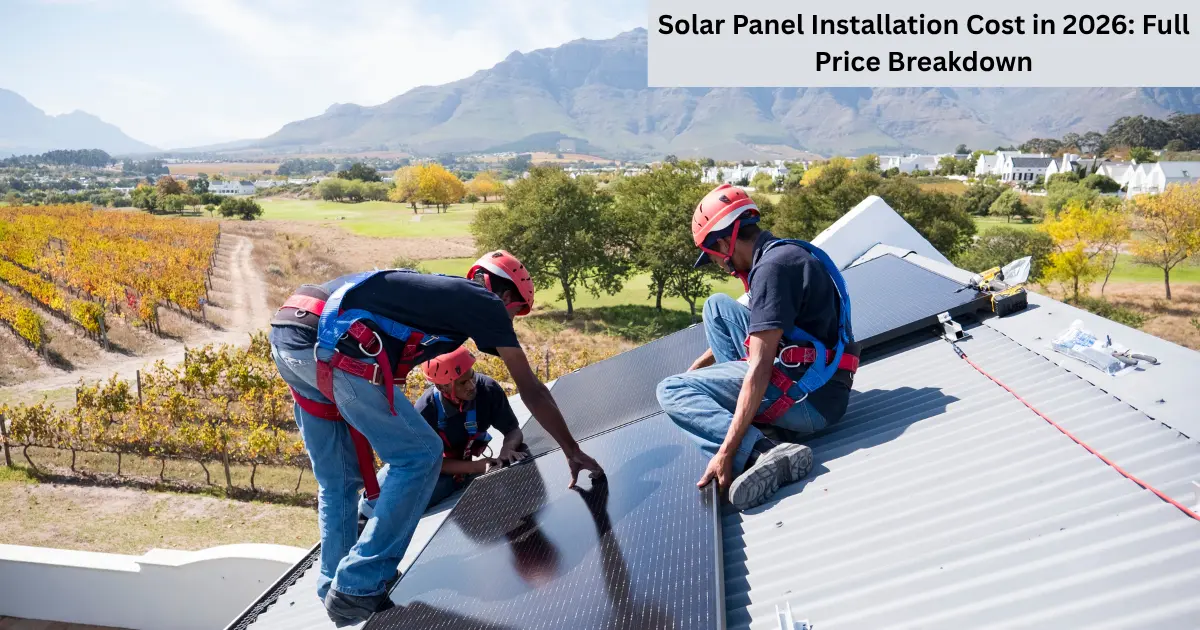
Solar panels are cheaper to install than ever — but the price still varies widely depending on your system size, location, and equipment. In 2026 the math also changed in one important way: the federal tax credit for purchased home systems expired at the end of 2025. This guide breaks down exactly what solar panel installation costs in 2026, where every dollar goes, how prices differ by state, and how to keep your costs down.
Quick Answer: How Much Does Solar Panel Installation Cost?
Key Takeaways
How Much Do Solar Panels Cost in 2026?
The single biggest factor in your price is system size, measured in kilowatts (kW). Bigger systems cost more in total but often a little less per watt. At a national average near $2.82 per watt, here’s what typical home systems cost before any incentives.
| System size | Typical installed cost | Best for |
|---|---|---|
| 5 kW | ~$14,000 | Small / efficient homes |
| 7 kW (average) | ~$19,500 | Average U.S. home |
| 10 kW | ~$28,000 | Large homes |
| 13 kW | ~$36,000 | Very large homes / EV / pool |
Costs before incentives, at ~$2.82/watt (national average). Based on ConsumerAffairs and NREL benchmarks; actual quotes vary by state and installer.
Not sure what size you need? Our guide on how many solar panels you need helps you size the system first — which is the real driver of your total cost.
Solar Cost Per Watt Explained
The fairest way to compare solar quotes is cost per watt — the total price divided by the system’s wattage. It strips out system size so you can compare apples to apples. A lower number means better value. Here’s the 2026 landscape.
| Scenario | Cost per watt |
|---|---|
| National average | ~$2.82 |
| Competitive / low end | ~$2.00 |
| Complex roof / high-cost areas | ~$3.50+ |
| Sunbelt example (Florida) | ~$2.20 |
| DIY (equipment only) | ~$0.80–$1.40 |
If a quote comes in above $3.00/watt without a clear reason (steep roof, premium panels, battery), it’s worth getting more bids.
What's Included: Cost Breakdown by Component
It surprises most people that the panels are only about a third of the price. The rest goes to the inverter, mounting hardware, electrical work, permits, and the installer’s design, sales, and overhead — the so-called “soft costs.”
| Component | Share | Cost on a $19,500 system |
|---|---|---|
| Solar panels | ~30% | ~$5,850 |
| Inverter | ~10% | ~$1,950 |
| Mounting & wiring | ~15% | ~$2,925 |
| Labor / installation | ~10% | ~$1,950 |
| Permits & fees | ~5% | ~$975 |
| Design, sales & overhead | ~30% | ~$5,850 |
This is exactly why DIY can save so much: handling design, sales, and labor yourself removes most of the soft costs. See our full step-by-step installation guide for the DIY route.
Solar Panel Cost by State
Where you live has a big effect on price. Labor rates, permitting fees, competition among installers, and local demand all push the cost per watt up or down. Sunbelt states tend to be cheaper per watt and pay back faster; high-cost regions like Hawaii sit at the top. Here are representative 2026 figures.
| State | Avg cost per watt | ~7 kW system cost |
|---|---|---|
| Florida | ~$2.20 | ~$15,400 |
| Arizona | ~$2.40 | ~$16,800 |
| Texas | ~$2.50 | ~$17,500 |
| National average | ~$2.82 | ~$19,700 |
| California | ~$2.90 | ~$20,300 |
| New York | ~$3.00 | ~$21,000 |
| Hawaii | ~$3.20+ | ~$22,400+ |
Approximate 2026 pre-incentive figures based on ConsumerAffairs and Solar.com state data. Get local quotes for an exact price.
The 2026 Tax-Credit Change: What It Means for Your Cost
This is the most important cost update for 2026, and many websites still have it wrong. For over a decade, a 30% federal tax credit slashed the net price of home solar. That changed under the One Big Beautiful Bill Act, signed in July 2025.
The 30% federal credit expired for purchases (Dec 31, 2025)
In practice, this means a homeowner buying outright in 2026 pays closer to the full sticker price, while a lease or PPA can still effectively access the 30% discount. It makes comparing financing options (below) more important than ever. The incentives that do remain are summarized here.
| Incentive | 2026 status |
|---|---|
| Federal credit — purchased system (25D) | Expired Dec 31, 2025 |
| Federal credit — lease / PPA (48E) | Still ~30% through 2027 |
| State tax credits / rebates | Available in many states |
| Net metering | Still offered (varies by utility) |
| SRECs | Select states only |
| Property & sales tax exemptions | Common in many states |
| Local utility rebates | Check your utility |
Tax rules change and vary by location. Confirm current programs (the U.S. DSIRE database and IRS guidance) before purchasing.
Battery Storage Cost
A solar battery isn’t required, but it’s the most popular add-on — it stores daytime power for night use and keeps the lights on during outages. It’s also the biggest single cost extra. Expect to add roughly $8,000–$15,000 for a typical home battery.
| Battery setup | Usable capacity | Typical installed cost |
|---|---|---|
| Single mid-range battery | ~10 kWh | ~$8,000–$12,000 |
| Premium battery (e.g. Powerwall-class) | ~13.5 kWh | ~$10,000–$15,000 |
| Whole-home backup (2+ batteries) | ~27+ kWh | ~$20,000–$30,000 |
If your main goal is lower bills (not backup), you may not need a battery at all — net metering lets the grid act as your “battery” for free where it’s available.
DIY vs Professional Installation Cost
Doing it yourself is the single biggest way to cut cost, because it removes labor and the installer’s soft costs — roughly half the total. The trade-off is the time, skill, permitting, and risk you take on.
| Factor | DIY | Professional |
|---|---|---|
| Cost per watt | ~$0.80–$1.40 | ~$2.50–$3.00 |
| Total for a 7 kW system | ~$7,000–$10,000 | ~$17,500–$21,000 |
| What you handle | Everything (design, permits, wiring) | Nothing — turnkey |
| Risk & warranty | Higher risk; limited warranty | Low risk; full warranty |
| Lease/PPA 30% credit | Not applicable (you own it) | Available via lease/PPA |
For most homeowners a professional install is worth it for the warranty and peace of mind; confident DIYers with simpler roofs can save thousands. Our solar installation guide walks through the DIY process step by step.
Financing: Cash, Loan, Lease or PPA?
How you pay matters more in 2026 than it used to — because the financing route now decides whether you can still access the 30% credit. Here’s how the four options compare.
| Option | Upfront cost | You own it? | 30% credit? | Best for |
|---|---|---|---|---|
| Cash | Full price | Yes | No (25D expired) | Lowest lifetime cost |
| Solar loan | $0–low | Yes | No | Owning with no big upfront |
| Lease | $0 | No | Yes (leasing co passes savings) | Low effort + capturing the credit |
| PPA | $0 | No | Yes (provider) | Paying only for power produced |
Buying with cash or a loan still gives the best long-term value (you own the system and all its savings), but a lease or PPA is now the only way for most homeowners to benefit from the 30% credit — worth running the numbers both ways.
Is Solar Still Worth It in 2026? Payback and Savings
Yes — even without the federal credit for purchases, solar still pays off for most homes; the payback period is simply a little longer than before. Over a 25-year lifespan, a typical system saves $20,000–$50,000+ in avoided electricity costs and shields you from rising utility rates. The payback timeline depends on how you pay, your local rates, and your sun.
Illustrative 2026 payback ranges. Cash purchases pay back a bit slower now that the 30% federal credit has expired for owned systems; leases/PPAs that still capture the credit pay back fastest.
The takeaway: solar is still a strong investment, but in 2026 the financing choice matters more. If maximizing return is your goal, compare a cash/loan purchase (you own everything) against a lease or PPA (which can still capture the 30% credit) before deciding.
How to Lower Your Solar Installation Cost
A few smart moves can cut thousands off your price:
| Tip | Why it saves money |
|---|---|
| Get at least 3 quotes | Per-watt prices vary widely between installers. |
| Right-size the system | Don’t pay for more panels than your usage needs. |
| Compare cash vs lease/PPA | A lease/PPA can still capture the 30% credit in 2026. |
| Choose standard panels | Premium panels rarely pay off unless roof space is tight. |
| Stack state & utility incentives | Local rebates and net metering still reduce net cost. |
| Install in the off-season | Installers may discount during slower months. |
| DIY part of the work | Removing labor/soft costs can halve the price. |
Right-sizing is the highest-leverage step — start with how many solar panels you actually need so you don’t overpay for capacity you won’t use.
Frequently Asked Questions
Conclusion: Budgeting for Solar in 2026
Solar panel installation in 2026 typically costs $2–$3 per watt — about $14,000–$28,000 for a normal home system, averaging near $19,500 for a 7 kW install. The biggest change this year is that the 30% federal tax credit ended for purchased systems, so how you finance the project now directly affects your bottom line. Even so, with 25-year savings of $20,000–$50,000+, solar remains a strong investment for most homes.
The bottom line
Ready to go deeper? First nail down your system size with how many solar panels you need, then walk through the full process in our step-by-step solar installation guide. And for the bigger picture on why energy independence matters, see our deep dive on the global energy crisis.
You May Also Like
Solar Panel Maintenance in 2026: How Often, What It Costs & a Simple Checklist

Is Solar Worth It in 2026? An Honest Cost, Savings & Payback Analysis
Best Outdoor Solar Lights in 2026: Types & Complete Buying Guide