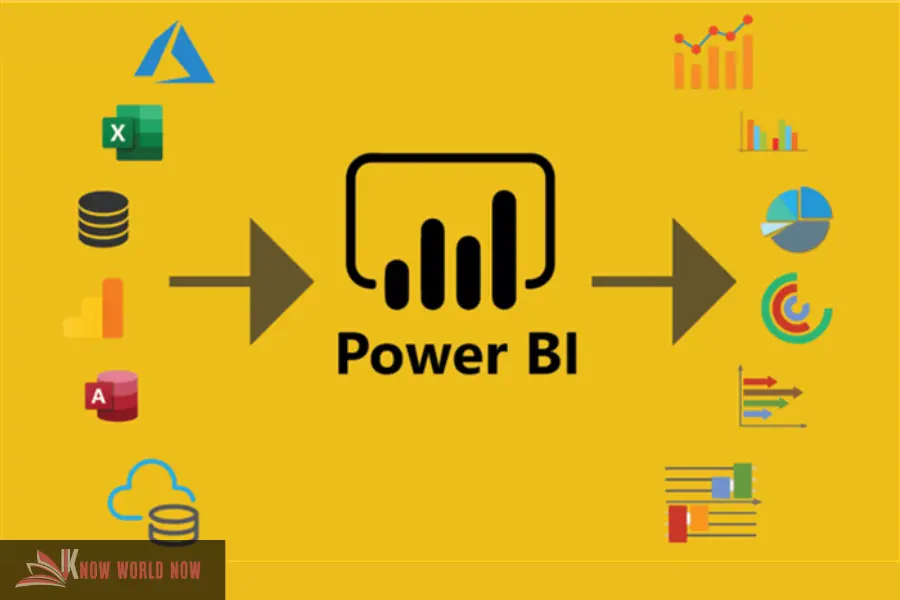
Microsoft’s Power BI is a powerful tool for compiling, analysing, visualising, and sharing data. Since its launch over a decade ago, Power BI has become an invaluable platform that is known to be an enterprise-ready, business intelligence and self-service platform with the added benefit of being unified and scalable.
Power BI stands out from its competitors and is a popular choice that is often recommended by top providers of IT Support London based companies like TechQuarters.
It’s popular for a number of reasons which include it being easy to use, affordable, scalable, integrates well with other Microsoft products, and offers a rich feature set. It is a good choice for businesses of all sizes that are looking for a powerful and flexible BI solution.
However, while Power BI is considered easy to use, even for those with no prior BI experience, there are ways of using the platform that will ensure users will be working as efficiently and effectively as possible. Here are the top tips and tricks to getting the most out of Power BI:
Power BI Performance Tips
Use the right dataset mode for your needs
Power BI offers two dataset modes – Import and DirectQuery. Import mode loads the entire dataset into memory, while DirectQuery mode queries the data source directly. It’s important to choose the dataset mode that is best suited for your needs and data size otherwise it can lead to slow performance, inaccurate data, and security risks.
Optimize your data model
It might seem obvious but it’s important to create a data model that is optimized for performance. This means avoiding unnecessary relationships and calculated measures. By optimizing your data model users will avoid slow performance, inaccurate results and unnecessary difficulties in maintaining their reports.
Use efficient visualization techniques
Some visualization techniques are more efficient than others. For example, tables and charts are generally more efficient than maps and images.
Those who provide professional IT Support in London point out that using the best techniques that are consistent, simple and concise will ultimately increase performance, allow for better understanding of data and decrease misleading insights.
Avoid using too many filters and slicers
Filters and slicers can impact performance, especially when used in combination. It’s ideal to avoid using too many filters and slicers in your reports. Users should keep it simple to increase the report’s usability and accuracy.
Use an efficient data gateway
If you are using a data gateway to connect to your data source, make sure that the gateway is properly configured and optimized for performance. This is mostly to ensure that reports are as performant, reliable, and cost-effective as possible.
Power BI Design Tips
Use consistent fonts, colours and visual styles
Using the same fonts and colours throughout your report will help create a consistent visual style. This also includes consistent design elements such as borders, drop shadows, and gradients. This consistency will ensure the report is easier to read and understand.
Use white space effectively
It’s important to not overload your report with too many visuals and text – less is always more in this case. Using white space to separate elements will make the report easier to scan and read.
Use clear and concise labels
Using clear and concise labels for all the elements in your report is another example of better readability. Using jargon or technical terms can lead to your audience not understanding the report as well as they could.
Align elements neatly
Make sure to align all the elements in the report neatly and consistently. Not only will this make the report easier to read, but it will also make it look more professional and polished.
Power BI Creator Tips
Use parameters in your report
Parameters are great for creating reports that are more dynamic and flexible. For example, you could use a parameter to allow users to select the date range or product category for the report. This will ultimately make the report more usable.
Use bookmarks for data
Bookmarks are a simple but effective way of allowing the user to create different views of their data and save them for later use. This can be helpful for creating reports that can be used for different purposes.
Use drill throughs to explore data in more detail
Providers of Office 365 Consulting London businesses frequently rely on, highly suggest using drillthroughs to allow users to explore their data in more detail by clicking on a data point in a visualization. This can be helpful for identifying trends and patterns in your data by focusing on specific entities.
Use calculated columns and measures to create custom metrics
Custom metrics that aren’t initially available in the data source can be created using calculated columns and measures. These custom metrics can be very helpful for creating reports that are tailored to specific business needs.
Use row-level security to restrict access to sensitive data
Row-level security (RSL) is essential to restricting access to sensitive data. This is especially important to help protect sensitive data from unauthorized users. It will allow users to control which users can see which rows of data in a table. It will ultimately improve compliance, reduce the risk of data leaks, and improve the user experience.
In conclusion, Power BI is a powerful tool that can help you to get insights from your data. However, it is important to use Power BI efficiently and effectively to get the most out of it. By following these simple tips and tricks, users can improve the performance, accuracy, cost-effectiveness, and insights of their Power BI reports.


![F95Zone Games - The Ultimate Guide for 2021 [F95Z Guide] 5 F95Zone Games](https://knowworldnow.com/wp-content/uploads/2021/07/ArTtW5LrK3b-z-0-y-637f48d86203817a9042a857.webp)